To count bird populations reliably, you need to pick a counting method (point count, transect, or feeder/roost count), define a clear area and time window, record every detection with enough detail to avoid double-counting, and then apply a simple correction for the birds you almost certainly missed. Raw counts almost always underestimate true abundance because you never detect every bird present. The steps below walk you through the whole process, from scoping out your survey site to turning your field notes into a usable population estimate.
How to Count Bird Populations: Methods, Steps, and Estimates

Marcus Hendricks
4 May 2026

Step 1: Know what you're actually trying to count
Before you go outside with your binoculars, get clear on your goal. Are you trying to answer 'how many of this species live in my local park?' or 'is this species more or less common than it was last year?' Those are different questions and they need slightly different designs.
You also need to define your 'population' concretely. In bird survey terms, a population isn't the whole country's worth of a species, it's the number of individuals present in a specific, bounded area during a specific time window. That could be a 5-hectare woodlot, a 500-meter stretch of hedgerow, or the quarter-mile radius around a single point. Get that area on a map before you start.
One more thing to decide up front: do you want an absolute abundance estimate (a real number like '42 birds per km²') or a relative abundance index (a number that's meaningful only when compared to counts from the same site at other times)? Absolute estimates require more work, specifically, correcting for detection probability. Relative indices are easier to collect but only tell you about trends, not true numbers. Both are legitimate depending on your goal.
Step 2: Choose the right counting method
There are three main approaches for most backyard birders and hobbyists. Each one suits different habitats and goals.
Point counts
You stand at a fixed spot for a set time (usually 5 to 10 minutes) and record every bird you see or hear within a defined radius. Point counts are the most widely used quantitative method in bird monitoring worldwide. They work well in woodland, shrub, and grassland habitats where you can't easily walk a straight line. The key rule: treat each count as a 'snapshot' of what's there at that moment, you're estimating the birds present at the point, not counting everything that wanders through.
Transect surveys
You walk a straight line (a transect) at a steady pace and record birds to the left and right, noting how far each bird is from the line. This is called a line transect or, when you stop at intervals, a point transect. Transects cover more ground than single points and work well in open habitats like fields, wetlands, or coastal areas. The perpendicular distance from the bird to your line is the critical measurement, it feeds into detection models later.
Feeder and roost counts
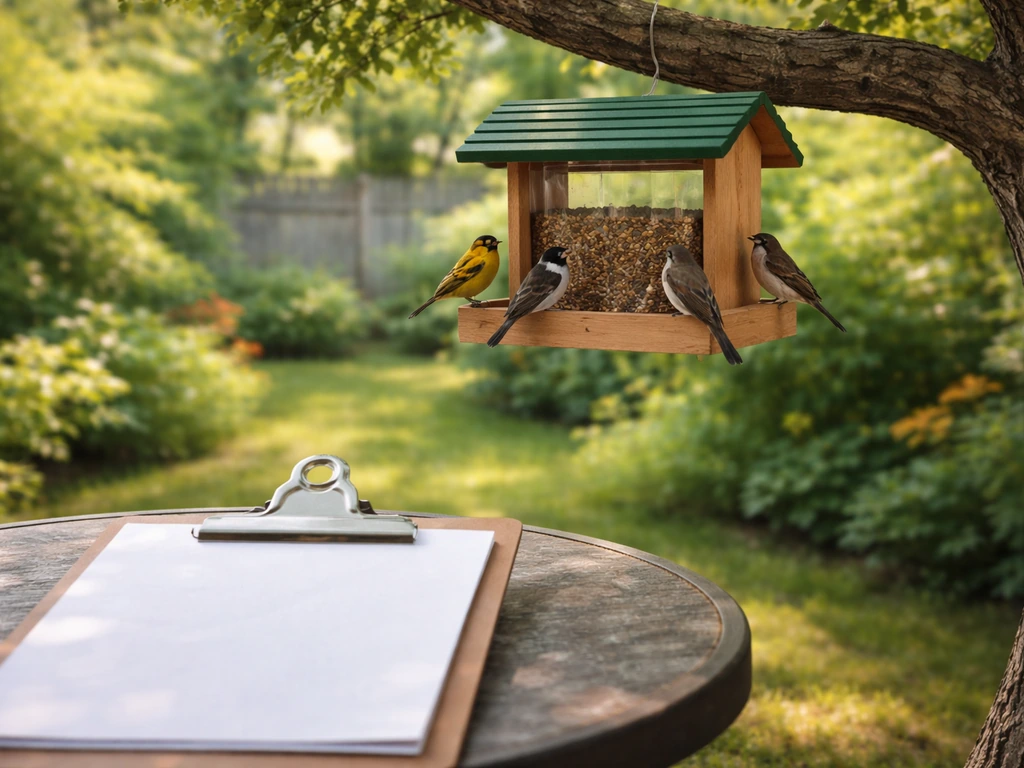
If you run a feeder or know of a communal roost site, you can do a structured count from that location. Programs like Project FeederWatch use this approach. The protocol is simple but strict: record the highest number of each species you see at one time during your count window. Do not add up individuals across multiple observations, that's how double-counting happens. A bird that flies away and returns is still the same bird. The trade-off is that feeder counts measure activity around an attractant, not unbiased abundance in the wider landscape. They're excellent for tracking trends at your site over time, but they won't tell you how many birds are in the surrounding habitat generally.
| Method | Best habitat | What you record | Gives absolute density? | Good for beginners? |
|---|---|---|---|---|
| Point count | Woodland, scrub, grassland | Species, number, distance, detection mode | Yes, with distance sampling | Yes |
| Line transect | Open fields, wetland edges, coast | Species, number, perpendicular distance | Yes, with distance sampling | Moderate |
| Feeder/roost count | Backyard, known roost site | Max simultaneous individuals | No — activity index only | Yes |
For most beginners, point counts are the best starting point. They're flexible, well-documented, and scale up easily if you want to compare results with citizen-science programs or professional surveys.
Step 3: Plan your survey properly
Timing

For most songbirds, the best window is the first two to three hours after sunrise during the breeding season (roughly April through July in the Northern Hemisphere). Birds are most vocally active then, which means your detection rate is at its highest and most consistent. Avoid counting in rain or wind strong enough to interfere with hearing, both conditions suppress detection rates and make your results incomparable with counts done in better conditions. US Forest Service field protocols are explicit about this: don't survey when rain or wind interfere.
Defining your area and setting boundaries
Draw your survey area on a map before you go. Mark your point count locations or transect lines with GPS coordinates or clear landmarks. For point counts, space your points at least 250 meters apart, ideally 300 meters or more, so that the same bird can't realistically be recorded at two adjacent points. This is one of the most common beginner mistakes: points placed too close together result in double-counting, which inflates your numbers.
Count duration and replication
Use the same count duration every time, 5 minutes is a common standard, though 10 minutes captures more species. Replication matters a lot. A single visit to a single point tells you almost nothing reliable. Run at least three visits to each point across the season, and try to cover at least five to ten points per habitat type you're surveying. More visits increase your cumulative detection probability, meaning you're less likely to miss a species that's actually present. Running multiple surveys on different days also helps you separate real changes in abundance from day-to-day variation in detectability.
Step 4: Record data correctly in the field
Good field notes are the whole foundation of a usable survey. Use a printed datasheet or a dedicated app so you don't forget fields under pressure. Here's what to record for every detection at a point count:
- Point ID or GPS coordinates
- Date and start time
- Observer name
- Weather conditions (wind speed, cloud cover, temperature)
- Species name (be honest — log unknowns as unknowns rather than guessing)
- Number of individuals
- Distance from you to the bird (estimate in meters: under 25m, 25-50m, 50-100m, over 100m is a workable set of bands)
- Detection mode: seen (S), heard singing (HS), heard call (HC), or flyover (FO)
- Direction (compass bearing or clock-face position)
Distance and detection mode are particularly important if you plan to model detection probability later. They're also useful for flagging potential double-counts: if you hear a bird singing to the north at 0:02 and then see a bird to the north at 0:05, that's probably the same individual. Mark it as one detection, not two.
Avoiding double-counts

Double-counting is the most common error in amateur bird surveys, and it's surprisingly easy to do. A bird that moves between your point count locations, or one you hear and then see, or one that circles a feeder multiple times, all of these can end up recorded as separate individuals. A few habits help a lot:
- Wait quietly at each point for a full minute before you start recording — let any birds flushed by your arrival resettle
- Track the approximate locations of birds actively in your head as the count progresses
- For point counts, don't count birds clearly in flight toward another point as resident birds at your current location
- For feeder counts, only ever record the maximum number seen simultaneously — never add up birds seen across the whole count session
- Flag any detection you're uncertain about with a question mark rather than committing to a number
Step 5: Correct for the birds you missed
Here's something that catches beginners off guard: the number you write down is almost never the true number of birds present. Detection probability, the chance of recording a bird that is actually there, is almost always less than 1.0, and it varies with weather, habitat, species, time of day, and observer skill. Two different observers counting at the same point on the same day will often get different totals. That's not a mistake; it's just how field detection works.
If you don't correct for this, your counts are 'relative abundance indices', useful for comparing your own surveys over time, but not reliable as absolute numbers. There are a few practical ways to handle this:
Distance sampling (best for absolute density)
If you recorded distances to each bird, you can use distance sampling. The core idea: birds close to you are detected nearly 100% of the time, while birds farther away are detected less reliably. By plotting your detection frequency against distance, you can fit a 'detection function' that tells you what fraction of birds in each distance band you actually detected. You then divide your raw count by that fraction to get a corrected estimate. Free software like Distance (from the University of St Andrews) can do this math for you with your field data. Miller (2019) documents distance sampling implementation in R, including how detection functions use distance data to estimate abundance and density. You'll need at least 40 to 60 detections of a species to fit a reliable detection function, another reason why replication matters.
Double-observer method (practical alternative)
Two observers count at the same point independently, then compare notes. Each observer detects a different subset of birds, and where the lists overlap you can mathematically estimate detection probability. It's more logistically complex but doesn't require measuring distances. The US Geological Survey has published accessible protocols for this approach if you want to go deeper.
If you're just tracking trends
If absolute density isn't your goal, a standardized index is fine. As long as you always count at the same points, at the same time of day, in similar weather, by the same observer, your raw counts are a meaningful relative measure. If your counts go up 30% from one year to the next, that's real signal, even if you never know the exact population size. This is exactly how long-term citizen-science programs like FeederWatch and the Christmas Bird Count build their trend data.
Step 6: Use your tools well (and know their limits)

Binoculars and spotting scopes
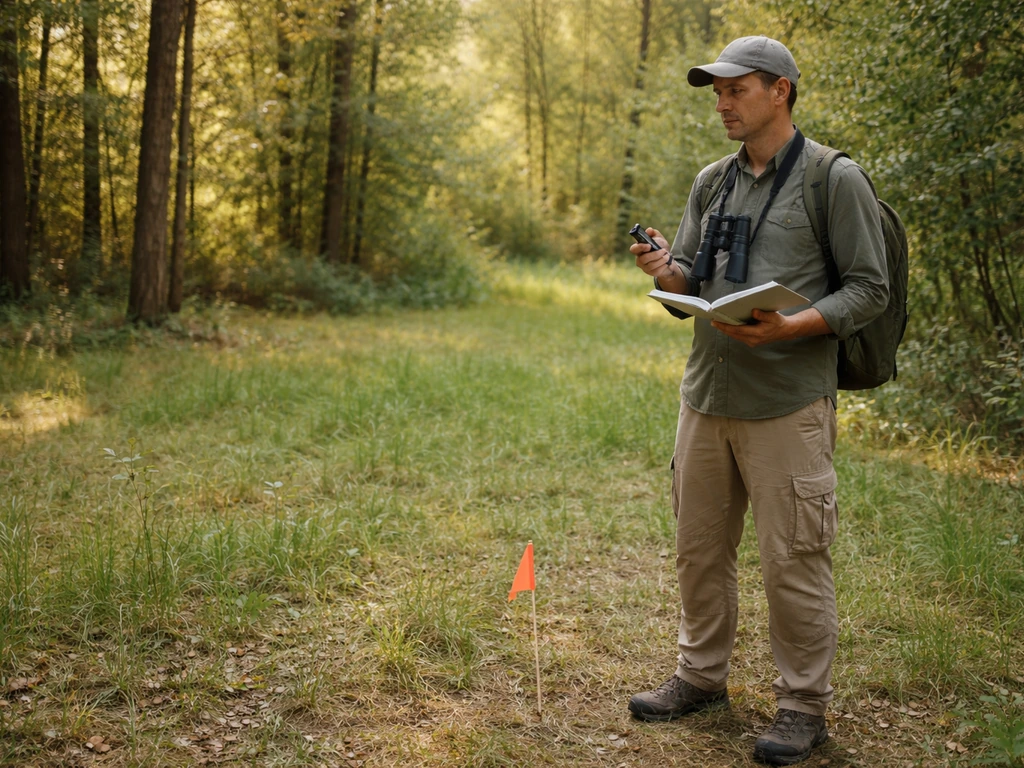
For most bird counts, 8x42 binoculars are the sweet spot, enough magnification to confirm species at distance, wide enough field of view to track moving birds. A spotting scope (20-60x) is worth bringing for open-habitat transects where birds may be 200 or more meters away and you need to confirm identification. Practice estimating distances before your first real survey, try marking out 25m, 50m, and 100m on a football field or parking lot so you have a gut feel for what each looks like in the field.
Bird ID apps and audio tools
Apps like Merlin (from Cornell Lab) can help confirm species identification from a song you're not sure about, and that's great. But be careful about how you use audio during an active survey. Playing back calls or song to attract birds, call playback, fundamentally changes bird behavior. It draws birds toward you, which can make your counts look higher than they really are and violates the core assumption of distance sampling (that birds are detected at their natural locations, not lured in). For general survey work, stick to passive listening. Save playback for specific detection tasks where you need to confirm presence, not count numbers.
Audio recorders and automated recording units (ARUs) can passively capture all sounds during a survey period and are increasingly used alongside or instead of human observers. They're particularly useful if you can't always be in the field at dawn. The recordings then need to be reviewed or run through automated detection software, which adds a processing step but creates a permanent, reviewable record of your survey.
eBird and citizen-science platforms
eBird is the best all-round tool for logging and storing your survey data. Use the 'Stationary' protocol (not 'Incidental') whenever you're doing a structured count. Incidental checklists lack effort information, start time, duration, area covered, which makes them nearly useless for scientific analysis. A Stationary eBird checklist captures exactly the effort metadata that makes your data comparable across visits and across observers. Enter your count duration, observer count, and any notes on conditions. If you upload photos or recordings as documentation, make sure they're from that specific survey, not borrowed from another date or location.
Step 7: Turn your field notes into an estimate and track change over time
Simple density estimate from point counts
If you used distance bands and want a rough density estimate without full distance-sampling software, here's a workable shortcut. Count all birds detected within your 'effective detection radius', typically 50 to 100 meters for a standard point count, depending on habitat. The survey area for a single point within a 100m radius is roughly 3.14 hectares (pi × 0.1km²). If you counted 5 birds of a species at that point, your raw density estimate is about 1.6 birds per hectare. Multiply that by your total survey area to get an area-wide estimate. Remember this is a raw index unless you've applied a detection correction, it's likely an undercount, so treat it as a minimum estimate.
Scaling up across multiple points
If you ran 8 points across a 10-hectare woodland and recorded an average of 3 individuals per point (within 50m), your combined effective survey area is 8 points × 0.785 hectares per point (50m radius) = about 6.3 hectares. Divide your total count (24 birds) by 6.3 to get a density of roughly 3.8 birds per hectare, then multiply by 10 hectares to estimate around 38 birds in your study area. This is back-of-envelope math, not a publishable figure, but it's a perfectly valid starting estimate for hobbyist monitoring.
Tracking trends
The real power of repeated surveys shows up over years, not days. Keep your datasheets (or eBird records) organized by site, season, and year. Even a simple spreadsheet with date, point ID, species, and count is enough. Plot your annual totals for each species and look for direction, are counts going up, down, or staying flat? Once you have three or more years of standardized data from the same points, you have a genuine local trend dataset. That's genuinely valuable, and it's exactly the kind of data that community bird atlases and regional conservation groups are hungry for.
Share your data
Uploading your structured checklists to eBird contributes to one of the largest bird monitoring databases in the world. If you're doing winter feeder counts, Project FeederWatch accepts participant data from across North America. The Christmas Bird Count (run by Audubon) organizes annual area counts using fixed 15-mile diameter circles and pooled observer teams, joining a local CBC group is one of the fastest ways to learn survey techniques from experienced counters and contribute to a dataset that goes back over 120 years. Local bird clubs and regional ornithological societies often run their own atlas projects too, and they're almost always looking for volunteers who can commit to repeated surveys of fixed areas.
Your first survey: a practical starting plan
If you've never done a structured bird count before, here's the simplest version that still produces usable data. It connects naturally to the same principles behind doing a proper bird survey, and the habits you build here will serve you well if you want to go further. A bird wattmeter helps you measure and compare power draw in live circuits so you can make informed adjustments safely. If you need a step-by-step guide that ties timing, method choice, and data corrections together, this overview covers how to do a bird count from start to finish.
- Pick one site you can visit at least once a week — a local park, woodland edge, or your backyard
- Mark three to five point count locations at least 250 meters apart on a map or GPS
- Set aside 45 to 60 minutes on a calm, dry morning within two hours of sunrise
- At each point, stand quietly for one minute, then count for five minutes — record every bird seen or heard, with your best distance estimate
- Note weather conditions and exact start time at each point
- Log the count as a Stationary checklist in eBird immediately after, while the details are fresh
- Repeat the same route on at least three separate mornings across the season
- After your third visit, compare totals per species across visits — that's your first trend line
Don't stress about getting everything perfect on day one. Estimating distances is a skill that improves with practice. Then, when you need a more hands-on check of a small bird’s condition, you can learn how to weigh a bird safely and accurately. Species identification gets easier every time. The most important thing is that you use the same protocol each visit, that consistency is what makes your data meaningful over time, even if individual counts feel rough and imprecise at first.
FAQ
How can I define the survey area if I do not have a formal study plot?
If your only realistic option is to survey a “whole neighborhood” or “my yard,” you still need a bounded area. Use a map to set a fixed radius (for example, 250 to 500 m from a central point) or choose clear edges (roads, waterways, property lines). Then keep the boundaries constant every visit, otherwise you will mix different habitats and effort levels and your trends will be hard to interpret.
What should I do if my birds are detectable much farther than the “typical” detection radius?
For density and corrections, the effective area assumption breaks if birds can be heard far beyond your chosen radius. A practical approach is to test your detection distance during early pilot visits (note typical max distance you reliably detect each common species). If detection clearly varies by species or terrain, use distance-based methods for those species rather than a single fixed radius shortcut.
How do I avoid counting the same bird twice when it moves between stations during a route?
Avoid “total birds seen” when birds move in and out. Instead, use the survey’s rule for one observation per bird per snapshot, for example one count per individual per point for point counts, or a single highest count during the feeder window for feeder protocols. If you are unsure whether two records are the same individual, mark it as a potential double-count and review it consistently rather than changing your rule mid-survey.
What if I cannot survey at the exact same time each week or season?
If you have to miss days, do not assume the gap is neutral. Reschedule to keep the same time-of-day window and similar weather as much as possible, and keep effort notes. When comparing years, restrict comparisons to the same season window and, if needed, down-weight species with very different detectability due to behavior changes.
Can I compare results across different observers or should I avoid that?
Yes, but keep consistency strong. If you switch observers, use either the same distance-measuring approach and review training, or switch to a method that can handle detection differences better (for example, double-observer mark-and-compare). Otherwise, differences between observers can look like real population change.
Are feeder or roost counts good for estimating the population in the surrounding habitat?
Feeder/roost counts are not unbiased for the wider landscape because the location acts like an attractant and draws birds from outside your nominal area. Treat feeder counts as local activity around the resource, and only compare them across time if the feeder setup and placement stay stable (same feeders, same coverage, similar food availability).
Can I apply detection corrections from one species to estimate others?
For multi-species surveys, detection probability is often species-dependent. A common mistake is to apply one distance correction designed for one species to all others. If you want corrected estimates, fit detection functions per species (or group only those species with similar detectability and enough detections). For simple trends, keep the raw index and analyze species separately.
When should I aim for absolute abundance versus using a relative abundance index?
If your survey goal is presence or relative change, do not waste time converting everything to density. For absolute abundance, distance sampling or another detection-probability approach is appropriate. If your data will only support comparisons, a standardized index is usually the most honest summary.
How should I handle marginal weather when I still want useful data?
Wind and rain affect not just whether birds are detected, but what you can confidently identify. A good practice is to set clear “do not count” thresholds (for example, sustained wind loud enough to obscure calls). If conditions vary within a session, consider stopping early or recording as “low quality” and excluding those visits from comparisons.
Does it matter exactly when I start counting after sunrise, and how should I standardize it?
Set a consistent start time and follow a fixed routine at each station. For example, begin the count immediately on arrival, limit setup time, and avoid scanning for long periods before the timer starts. Also, note if sunlight conditions change quickly, since glare and shadow can influence both visual ID and distance estimation.
Can I use audio playback during my survey if I am mostly confirming identification?
Use passively collected audio for confirmation, not for increasing counts. Playback can inflate apparent abundance and violates the assumptions behind detection correction methods. If you need audio to confirm a difficult call, do it only after completing the counting window, or run separate confirmation trials clearly labeled as non-quantitative.
What are common field problems that make distance measurements unreliable?
For distance sampling, check that you can assign a perpendicular distance accurately and consistently. If you often struggle with distance to birds that are not directly in the horizontal plane (for example, over ridges or tall canopy), switch to a point-count approach that relies less on distance, or restrict to habitats where perpendicular distance is feasible. Consistency beats “best effort” randomness.
How do I clean up field notes to reduce double-counting before I compute estimates?
Do a quick “data QA” before leaving the field or the same day. Flag anything that could be a repeat (for example, repeated detections of the same bird in consecutive minutes from the same bearing, or multiple records within the same count window that have identical features). Then keep a written rule for how you consolidate those cases, so your corrections do not vary by species or mood.
What data should I store at the individual-detection level versus just keeping totals?
For pocket-sized projects, storing raw detections with timestamps can outperform only storing totals. If you can, log each detection with species, time within the count, and (for point counts) estimated distance band. That makes it easier later to spot duplicates, rerun analyses, and compare to other datasets even if you refine your method.
Next Article
How to Conduct a Bird Survey: Beginner Field Guide
Step-by-step guide to conduct a bird survey, from choosing sites and methods to recording IDs and sharing results.